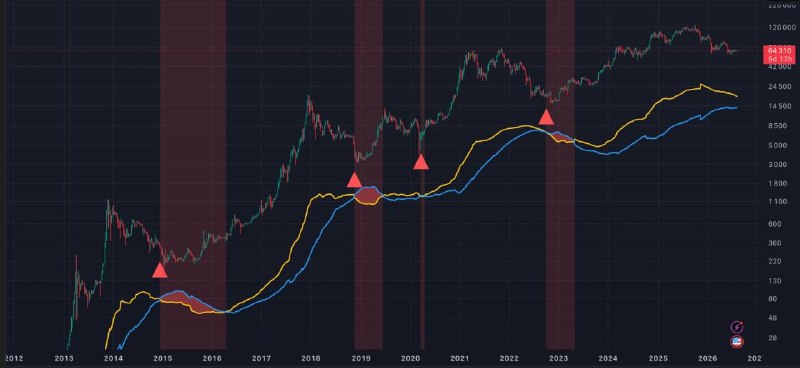
The best indicator for Bitcoin's bottom right now is the crossover of Realized Losses and Realized Profits 💸The video shows that the indicator worked perfectly in previous cycles and hasn't yet given a signal that the bottom has been reached.Analytics platforms hide Realized Losses and Realized Profits behind a paid subscription, so for you, we created a new similar indicator for TradingView (see screenshot), which you can add in 5 minutes and use completely free 🏀How to add the indicator:1. Log into your TradingView account, open the BTC/USD candlestick chart, select the 1W timeframe, and switch to a logarithmic scale.2. In the bottom right corner, open the menu (the circle icon with dots) and select "Pine Editor".3. A code window will open; clear the default template and paste the code below://@version=5 indicator("BTC Realized P/L Exact Video [Final]", shorttitle="RPL Video Final", overlay=true) //==========================================// 1. DEFAULT SETTINGS// ==========================================ema_len = input.int(59, "EMA Smoothing Length (weeks)", minval=1)spread_mult = input.float(44.0, "Line Spread (Separate yellow/blue)", minval=1.0)level_shift = input.float(0.18, "Line Level Below Price (18% of BTC)", minval=0.05, maxval=0.5)// ==========================================// 2. DATA AND EMA SMOOTHING// ==========================================sopr_raw = request.security("GLASSNODE:BTC_SOPR", "W", close)sopr_smooth = ta.ema(sopr_raw, ema_len)// Baseline below candles (18% of BTC price)base_line = ta.sma(close, 80) * level_shift// ==========================================// 3. LINE SPREAD CALCULATION// ==========================================dev = (sopr_smooth - 1.0) * spread_multprofit_line = base_line * math.exp(dev)loss_line = base_line * math.exp(-dev)// ==========================================// 4. LINE PLOTTING// ==========================================p_prof = plot(profit_line, "Realized Profit (Yellow)", color=#FFC107, linewidth=2)p_loss = plot(loss_line, "Realized Loss (Blue)", color=#2196F3, linewidth=2)// ==========================================// 5. CAPITULATION ZONES AND BUY SIGNAL// ==========================================is_capitulation = loss_line > profit_line// Red background and fill between linesbgcolor(is_capitulation ? color.new(#FF5252, 85) : na, title="Bottom Zone")fill(p_loss, p_prof, color = is_capitulation ? color.new(#FF5252, 60) : na, title="Gap Fill")// Buy signal triangle below candles at the crossover momentsignal_buy = ta.crossover(loss_line, profit_line)plotshape(signal_buy, title="Buy Signal", style=shape.triangleup, location=location.belowbar, color=#FF5252, size=size.normal)4. Click "Save" and "Add to chart" at the top of the editor.No indicator provides a 100% guarantee, but this one has worked flawlessly through all previous cycles. Save this indicator for yourself and share it with your friends 👍
← Coin Post – Money, Investments, Bitcoin
Coin Post – Money, Investments, Bitcoin
12 August 2026, 14:01
346 views
The conversation
This channel has no discussion group attached, so there are no comments to read. Most broadcast channels — Binance, Moneycontrol, Whale Alert — have them switched off. If it does have one, add it on the channel list.